Arctic oscillation
The Arctic oscillation (AO) or Northern Annular Mode/Northern Hemisphere Annular Mode (NAM) is a weather phenomenon at the Arctic and Antarctic poles north (or south) of 20 degrees latitude. The index varies over time with no particular periodicity, and is characterized by non-seasonal sea-level pressure anomalies of one sign in the Arctic, balanced by anomalies of opposite sign centered at about 37–45N.[1]
The North Atlantic oscillation (NAO) is a close relative of the AO. There is debate over whether one or the other is more fundamentally representative of the atmosphere's dynamics. The NAO may be identified in a more physically meaningful way, which may carry more impact on measurable effects of changes in the atmosphere.[2]
Description
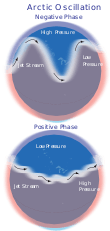
The AO appears as a ringlike (or "annular") pattern of sea-level pressure anomalies centered at the poles. The presence of continents and large landmasses disrupts the ringlike structure at the Arctic pole, while anomalies surrounding the Antarctic pole are nearly circular.
The AO is believed by climatologists to be causally related to (and thus partially predictive of) global weather patterns. NASA climatologist Dr. James E. Hansen explained the mechanism by which the AO affects weather at points so distant from the Arctic, as follows:
The degree to which Arctic air penetrates into middle latitudes is related to the AO index, which is defined by surface atmospheric pressure patterns. When the AO index is positive, surface pressure is low in the polar region. This helps the middle latitude jet stream to blow strongly and consistently from west to east, thus keeping cold Arctic air locked in the polar region. When the AO index is negative, there tends to be high pressure in the polar region, weaker zonal winds, and greater movement of frigid polar air into middle latitudes." [3]
Periodicity
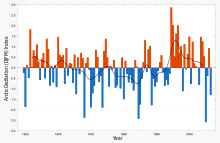
Over most of the past century, the Arctic Oscillation alternated between positive and negative phases. Data using a 60-day running mean has implied the oscillation has been trending to more of a positive phase since the 1970s , though it has trended to a more neutral state in the last decade. The oscillation still fluctuates stochastically between negative and positive values on daily, monthly, seasonal and annual time scales, although meteorologists have attained high levels of predictive accuracy for shorter term forecasts. (The correlation between actual observations and the 7-day mean GFS ensemble AO forecasts is approximately 0.9.)[4]
This zonally symmetric seesaw between sea level pressures in polar and temperate latitudes was first identified by Edward Lorenz [5] and named in 1998 by David W.J. Thompson and John Michael Wallace.[6]
Impacts
The National Snow and Ice Data Center describes the effects of the AO in some detail. In the positive phase, higher pressure at midlatitudes drives ocean storms farther north, and changes in the circulation pattern bring wetter weather to Alaska, Scotland and Scandinavia, as well as drier conditions to the western United States and the Mediterranean. In the positive phase, frigid winter air does not extend as far into the middle of North America as it would during the negative phase of the oscillation. This keeps much of the United States east of the Rocky Mountains warmer than normal, but leaves Greenland and Newfoundland colder than usual. Weather patterns in the negative phase are in general "opposite" to those of the positive phase.
Climatologists are now routinely invoking the Arctic Oscillation in their official public explanations for extremes of weather. The following statement from the National Oceanic and Atmospheric Administration's National Climatic Data Center: State of the Climate December 2010 which uses the phrase "negative Arctic Oscillation" four times, is very representative of this increasing tendency:
- "Cold arctic air gripped western Europe in the first three weeks of December. Two major snowstorms, icy conditions, and frigid temperatures wreaked havoc across much of the region...The harsh winter weather was attributed to a negative Arctic Oscillation, which is a climate pattern that influences weather in the Northern Hemisphere. A very persistent, strong ridge of high pressure, or 'blocking system', near Greenland allowed cold Arctic air to slide south into Europe. Europe was not the only region in the Northern Hemisphere affected by the Arctic Oscillation. A large snow storm and frigid temperatures affected much of the Midwest United States on December 10–13...."[7]
Events of 2010
A further, quite graphic illustration of the effects of the negative phase of the oscillation occurred in February 2010. In that month, the Arctic Oscillation reached its most negative monthly mean value at about −4.266, in the entire post-1950 era (the period of accurate record-keeping).[8] That month was characterized by three separate historic snowstorms in the mid-Atlantic region of the United States. The first storm precipitated 25 inches (640 mm) on Baltimore, Maryland on February 5–6, and a second storm precipitated 19.5 inches (500 mm) on February 9–10. In New York City, a separate storm deposited 20.9 inches (530 mm) on February 25–26. Another snowstorm swept Catalonia as well as neighbouring French departments (Languedoc-Rousillon, Midi-Pyrenées) on March 8, depositing 60 cm of snow in Girona[9]. This kind of snowstorm activity is considered to be highly anomalous, and as extreme as the negative AO value itself.
The greatest negative value for the AO since 1950 in January was −3.767 in 1977, which coincided with the coldest mean January temperature in New York City, Washington, D.C., Baltimore, and many other mid-Atlantic locations in that span of time. And though the January AO has been negative only 60.6% of the time between 1950 and 2010, 9 of the 10 coldest Januarys in New York City since 1950 have coincided with negative AOs.[10]
See also
References
- ↑ Arctic Oscillation (AO) time series, 1899 – June 2002
- ↑ Ambaum et al. "Arctic Oscillation or North Atlantic Oscillation?"
- ↑ Hansen, James; Reto Ruedy; Makiko Sato; Ken Lo (2009). "If It's That Warm, How Come It's So Damned Cold?" (PDF). Retrieved 2013-07-17.
- ↑ "CPC – Monitoring & Data: Daily Arctic Oscillation Index". Retrieved 2012-01-29.
- ↑ Lorenz, Edward N. (1951). "SEASONAL AND IRREGULAR VARIATIONS OF THE NORTHERN HEMISPHERE SEA-LEVEL PRESSURE PROFILE". Journal of Meteorology. 8 (1): 52–59. Bibcode:1951JAtS....8...52L. doi:10.1175/1520-0469(1951)008<0052:SAIVOT>2.0.CO;2. ISSN 1520-0469. Retrieved 2010-08-28.
- ↑ Thompson, David W. J.; John Michael Wallace (1998). "The Arctic oscillation signature in the wintertime geopotential height and temperature fields". Geophysical Research Letters. 25 (9): 1297–1300. Bibcode:1998GeoRL..25.1297T. doi:10.1029/98GL00950. Retrieved 2010-08-28.
- ↑ "State of the Climate | December 2010". Retrieved 2012-01-29.
- ↑ Ripesi, Patrizio; et al. (2012). "The February 2010 Arctic Oscillation Index and its stratospheric connection" (PDF). Quarterly Journal of the Royal Meteorological Society. 138: 1961–1969. Bibcode:2012QJRMS.138.1961R. doi:10.1002/qj.1935.
- ↑ Llasat, M.C.; et al. (2014). "The snow storm of 8 March 2010 in Catalonia (Spain): a paradigmatic wet-snow event with a high societal impact" (PDF). Natural Hazards and Earth System Sciences. 14: 427–441. doi:10.1594/nhess-14-427-2014.
- ↑ National Weather Service Climate Prediction Center and NWS Forecast Office, as of 2010
External links
| Wikimedia Commons has media related to Arctic oscillation. |
- Overview of Arctic Climate Indices
- Monthly Northern Hemisphere Annular Mode (NAM) Index or Arctic Oscillation (AO) Index 1850 - 2013
- Daily Northern Hemisphere Annular Mode (NAM) Index or Arctic Oscillation (AO) Index 1948 - 2013
- NOAA 3-month running mean AO Index 1950 – 2009
- Arctic roots of 'upside-down' weather BBC news, Tuesday, 5 January 2010
Arctic topics | |
|---|---|
| History |
|
| Government | |
| Geography |
|
| Regions | |
| Climate | |
| Fauna | |
| Flora | |
| Culture | |
| Economy |
|
| Transport | |
| |