< XForms 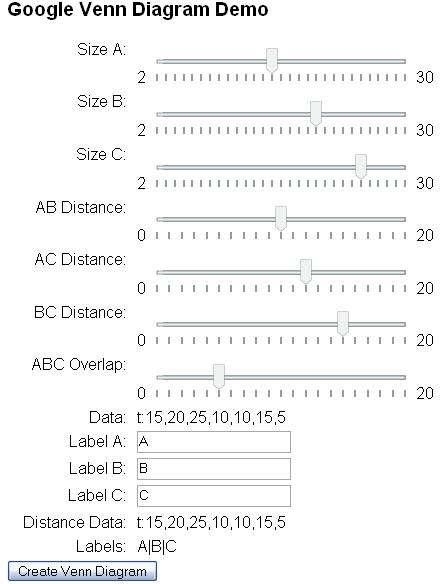

Motivation
You want to interactively change Venn Diagram parameters.
Method
Use XForms range controls to change values in a form. Use the bind to concatenate input parameters. Use the incremental attribute to allow the user to see the changes as the range controls change. Sending a submit will alter the Venn Diagram REST parameters.
Screen Image of User Interface
XForms User Interface for Venn Diagram
Output of Call to Google Charts
Output of XForms REST call to Google Charts
Link to Executable Example
Program Code
<html xmlns="http://www.w3.org/1999/xhtml"
xmlns:xf="http://www.w3.org/2002/xforms"
xmlns:ev="http://www.w3.org/2001/xml-events"
xmlns:xs="http://www.w3.org/2001/XMLSchema">
<head>
<title>Google Venn Diagram</title>
<style type="text/css">
@namespace xf url("http://www.w3.org/2002/xforms");
body {font-family: Helvetica, sans-serif}
/* This line ensures all the separate input controls appear on their own lines */
xf|input, xf|range, xf|output {display:block; margin:5px 0;}
/* this puts the labels in120px columns and right aligns them */
xf|input > xf|label, xf|range > xf|label, xf|output > xf|label
{text-align:right; padding-right:10px; width:120px; float:left; text-align:right;}
.xf-value {width: 150px}
</style>
<xf:model>
<xf:instance id="chart-params" xmlns="">
<data>
<cht>v</cht>
<chs>400x400</chs>
<chd/>
<chdl/>
</data>
</xf:instance>
<!-- temp variables that are concated together to create the parameter -->
<xf:instance xmlns="" id="tmp">
<data>
<sa>15</sa>
<sb>20</sb>
<sc>25</sc>
<ab>10</ab>
<ac>12</ac>
<bc>15</bc>
<abc>5</abc>
<la>A</la>
<lb>B</lb>
<lc>C</lc>
</data>
</xf:instance>
<xf:bind nodeset="instance('tmp')/sa" type="xs:integer"/>
<xf:bind nodeset="instance('tmp')/sb" type="xs:integer"/>
<xf:bind nodeset="instance('tmp')/sc" type="xs:integer"/>
<xf:bind nodeset="instance('tmp')/ab" type="xs:integer"/>
<xf:bind nodeset="instance('tmp')/ac" type="xs:integer"/>
<xf:bind nodeset="instance('tmp')/bc" type="xs:integer"/>
<xf:bind nodeset="instance('tmp')/abc" type="xs:integer"/>
<xf:bind nodeset="instance('chart-params')/chd" calculate="concat( 't:',
instance('tmp')/sa, ',',
instance('tmp')/sb, ',',
instance('tmp')/sc, ',',
instance('tmp')/ab, ',',
instance('tmp')/ab, ',',
instance('tmp')/bc, ',',
instance('tmp')/abc
)"/>
<xf:bind nodeset="instance('chart-params')/chdl" calculate="concat(
instance('tmp')/la, '|',
instance('tmp')/lb,'|',
instance('tmp')/lc
)"/>
<xf:submission id="get-chart" action="http://chart.apis.google.com/chart" method="get"
separator="&" ref="instance('chart-params')" replace="all"/>
<!-- put the cursor in the first field when the form becomes ready -->
<xf:action ev:event="xforms-ready">
<xf:setfocus control="field-1"/>
</xf:action>
</xf:model>
</head>
<body>
<h3>Google Venn Diagram Demo</h3>
<xf:range ref="instance('tmp')/sa" start="2" end="30" step="1" incremental="true">
<xf:label>Size A: </xf:label>
</xf:range>
<xf:range ref="instance('tmp')/sb" start="2" end="30" incremental="true">
<xf:label>Size B: </xf:label>
</xf:range>
<xf:range ref="instance('tmp')/sc" start="2" end="30" incremental="true">
<xf:label>Size C: </xf:label>
</xf:range>
<xf:range ref="instance('tmp')/ab" start="0" end="20" incremental="true">
<xf:label>AB Distance: </xf:label>
</xf:range>
<xf:range ref="instance('tmp')/ac" start="0" end="20" incremental="true">
<xf:label>AC Distance: </xf:label>
</xf:range>
<xf:range ref="instance('tmp')/bc" start="0" end="20" incremental="true">
<xf:label>BC Distance: </xf:label>
</xf:range>
<xf:range ref="instance('tmp')/abc" start="0" end="20" incremental="true">
<xf:label>ABC Overlap: </xf:label>
</xf:range>
<xf:output ref="chd">
<xf:label>Data:</xf:label>
</xf:output>
<xf:input ref="instance('tmp')//la">
<xf:label>Label A: </xf:label>
</xf:input>
<xf:input ref="instance('tmp')/lb">
<xf:label>Label B: </xf:label>
</xf:input>
<xf:input ref="instance('tmp')/lc">
<xf:label>Label C: </xf:label>
</xf:input>
<xf:output ref="instance('chart-params')/chd">
<xf:label>Distance Data:</xf:label>
</xf:output>
<xf:output ref="instance('chart-params')/chdl">
<xf:label>Labels:</xf:label>
</xf:output>
<xf:submit submission="get-chart">
<xf:label>Create Venn Diagram</xf:label>
</xf:submit>
</body>
</html>
Discussion
This article is issued from
Wikibooks.
The text is licensed under Creative
Commons - Attribution - Sharealike.
Additional terms may apply for the media files.