< XForms 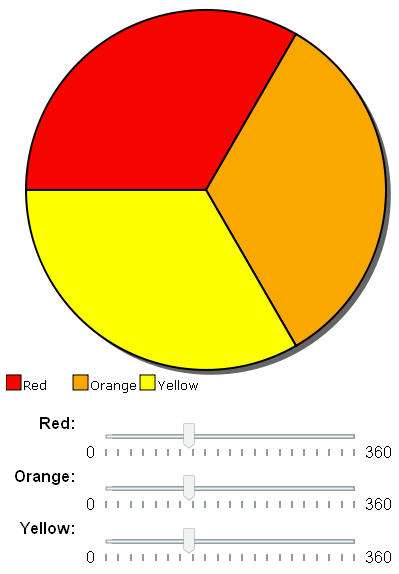
Motivation
You want to use range controls to interactively change a drawing such as a pie chart. In this case we use a JavaScript library that modifies an SVG image. The data for the pie chart is kept in an instance in the model.
Screen Image
XForms Pie Chart
Link to Working XForms Application
Sample Program
<?xml version="1.0" encoding="iso-8859-1"?>
<html xmlns="http://www.w3.org/1999/xhtml" xmlns:xf="http://www.w3.org/2002/xforms" xmlns:ev="http://www.w3.org/2001/xml-events" xmlns:xsd="http://www.w3.org/2001/XMLSchema" xmlns:xsi="http://www.w3.org/2001/XMLSchema-instance" xmlns:svg="http://www.w3.org/2000/svg" xmlns:xlink="http://www.w3.org/1999/xlink" xmlns:xi="http://www.w3.org/2001/XInclude">
   <head>
      <link rel="stylesheet" href="pie-chart.css" type="text/css" />
      <title>Pie Chart with XForms Range Controls</title>
      <script type="text/javascript" src="pie-chart.js" />
      <xf:model id="theModel">
         <xf:instance id="theData">
            <charts xmlns="">
               <piechart>
                  <wedge01>120</wedge01>
                  <wedge02>120</wedge02>
                  <wedge03>120</wedge03>
                  <wedge04>0.00</wedge04>
               </piechart>
            </charts>
         </xf:instance>
         <!-- Section 2 -->
         <xf:bind nodeset="/charts/piechart/wedge01" type="xsd:decimal" />
         <xf:bind nodeset="/charts/piechart/wedge02" type="xsd:decimal"  />
         <xf:bind nodeset="/charts/piechart/wedge03" type="xsd:decimal" />
         <xf:bind nodeset="/charts/piechart/wedge04" type="xsd:decimal" />
         <xf:bind nodeset="/charts/piechart/wedge04" calculate="/charts/piechart/wedge01 + /charts/piechart/wedge02 + /charts/piechart/wedge03" />
      </xf:model>
   </head>
   <body onload="showChart('chart')">
      <h1>Pie Chart with XForms Range Controls</h1>
      <div id="chart">
         <!-- Placeholder for chart.  Javascript will load here. -->
      </div>
       <br />
      <xf:range ref="/charts/piechart/wedge01" id="s2l1" start="0" end="360" incremental="true">
         <xf:label>Red:</xf:label>
         <xf:action ev:event="xforms-value-changed">
            <xf:load resource="javascript:updateChart('chart')" />
         </xf:action>
      </xf:range>

      <xf:range ref="/charts/piechart/wedge02" start="0" end="360" incremental="true">
         <xf:label>Orange:</xf:label>
         <xf:action ev:event="xforms-value-changed">
            <xf:load resource="javascript:updateChart('chart')" />
         </xf:action>
      </xf:range>

      <xf:range ref="/charts/piechart/wedge03" start="0" end="360" incremental="true">
         <xf:label>Yellow:</xf:label>
         <xf:action ev:event="xforms-value-changed">
            <xf:load resource="javascript:updateChart('chart')" />
         </xf:action>
      </xf:range>
   </body>
</html>
Discussion
This example a nice clean way to interactively change a value just using the mouse. No keyboard required. Here is the sample for the first range control:
<xf:range ref="/charts/piechart/wedge01" start="0" end="360" incremental="true">
    <xf:label>Red:</xf:label>
    <xf:action ev:event="xforms-value-changed">
        <xf:load resource="javascript:updateChart('chart')" />
    </xf:action>
</xf:range>
This is an example of how an instance document can be used as the interface to an external component in a form. You just have to put the data in the instance and tell the application to get the data.
Credits
This example was originally inspired by the 1040 tax form example on the Mozilla web site. The JavaScript for drawing the pie chart was taken from that example.
This article is issued from
Wikibooks.
The text is licensed under Creative
Commons - Attribution - Sharealike.
Additional terms may apply for the media files.