Below are graphs and data for an 6-lane urban freeway (I-43/I-894 near Milwaukee) and 4-lane inter-regional (I-94 west of Eau Claire). All data comes from the NPMRDS data set in January 2012.
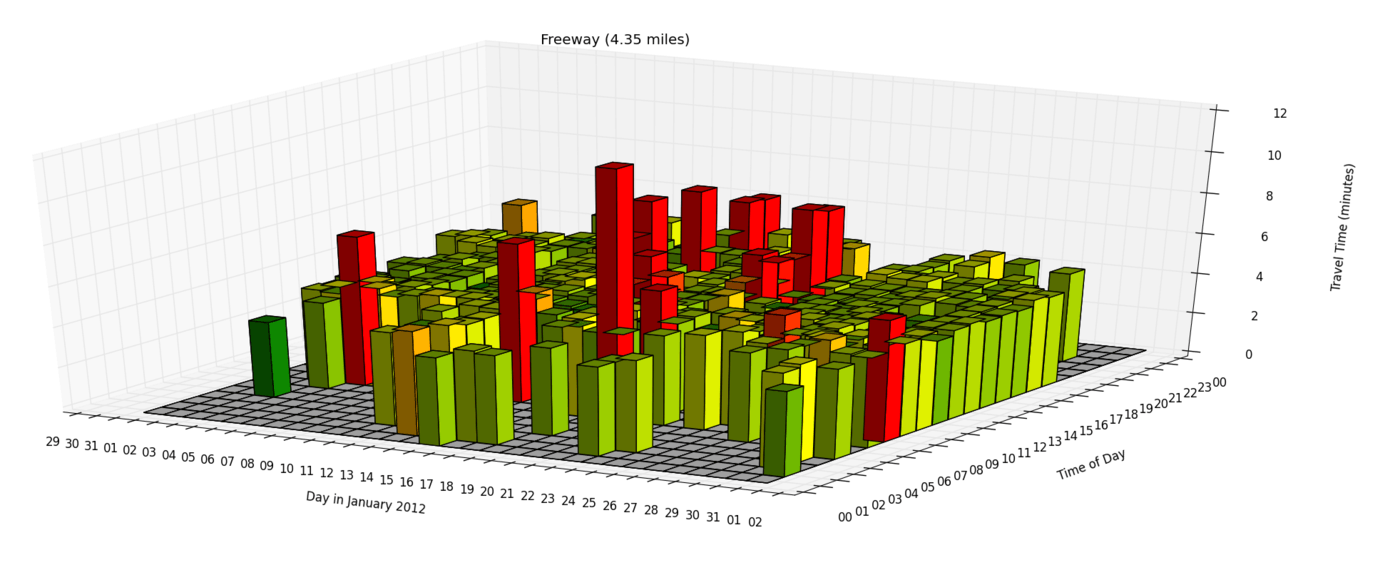
6-lane urban freeway (4.35 miles) Free flow travel time is based on the 70th percentile travel time
| Reliability Index | Value |
|---|---|
| TTI | 1.01 |
| BI | 0.26 |
| OPT | 94.90 |
| PTI | 1.27 |
| TTI80 | 1.02 |
| MI | 1.40 |
| Travel Time in minutes | |
|---|---|
| Mean | 4.58 |
| Free Flow | 4.55 |
| 95th % | 5.76 |
| 80th % | 4.65 |
| 97.5th % | 6.47 |
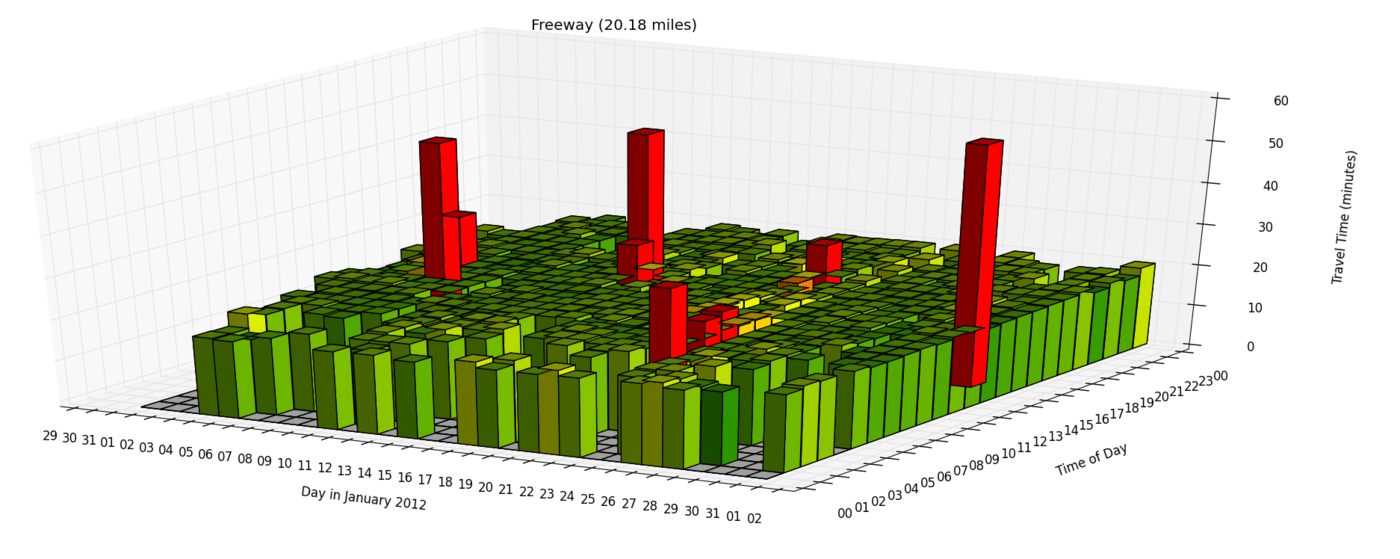
4-lane interregional freeway (20.18 miles) Free flow travel time is based on speed limit of 65mph
| Reliability Index | Value |
|---|---|
| TTI | 1.03 |
| BI | 0.06 |
| OPT | 98.40 |
| PTI | 1.09 |
| TTI80 | 1.038 |
| MI | 1.150 |
| Travel Time in minutes | |
|---|---|
| Mean | 19.26 |
| Free Flow | 18.63 |
| 95th % | 20.38 |
| 80th % | 19.33 |
| 97.5th % | 21.42 |
The 3-D graphs below show travel times by day and by hour for each corridor. Visually, one can see the better reliability of the inter-regional corridor over the urban. Blank areas represent points where real-time data did not exist along the entire corridor.
Travel Times for 6-lane Urban Freeway in January 2012
Travel Times for 4-lane Inter-regional Freeway in January 2012