Understanding the Node Graph
With the Node Graph you can apply operations on images and create 3D effects. The node graph provides a visual structure to represent
- a relation's tree of entities in a 3D world,
- and a sequence of operations on images.
The node graph is represented by nodes connected to each other by lines referred to as edges. In this node-based workflow each node in the graph performs a specific function.
Node inputs are on the top of the node. Node outputs are on the bottom of the node. The output port of one node is attached to the input port of the next node down in the node graph.
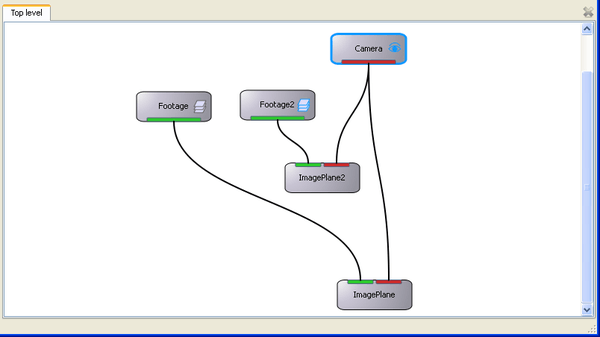
Nodes inputs and outputs are color coded, green and red, representing the 2 types of ports. Edges can only be connected between ports of the same color (type). As said before, the node graph can be used to structure a 3D world and perform operations on images. Nodes with green ports are image nodes, they apply image processing operations over the input image and return the processed image in their output port. The nodes with only red ports are called 3D nodes, they simply represent a structure of a 3D world. The ImagePlane node is the only node with ports of different colors, used to bring a image to the 3D space. Inputs and outputs can also have tool tips describing the data they provide.

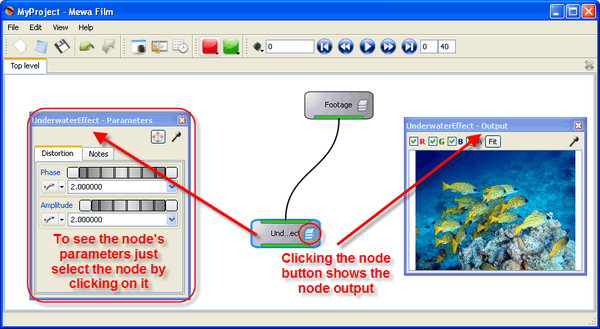
As you create a node graph you need to edit nodes parameters and visualize the output of different nodes. Parameter windows allow you to edit node's parameters while using the output window to inspect the different steps of the node graph. To bring up the parameters window just click over a node, selecting it. A parameters window pops up showing the node's parameters if no parameters window is open already. By default only one parameters window is opened and everytime a node is selected the node's parameters will be show in the opened parameters window.
The output window as a similar behaviour as the parameters window. To show the output window use the node's button located the right side of the node. Not all nodes have a output button, and different nodes might have different buttons. Clicking this button opens a output window in the same way a parameters window pops up.
To have more than one parameters window or output window see ...
Using the parameters window to modify one node parameter while visualising the result at a different node is one of the great advantages of using a node graph.
Applying operations on images
Image nodes are a subset of the Mewa Film nodes and understanding a node graph of image nodes is different to understanding a node graph of 3D nodes. Image nodes have green ports, they receive images as inputs and output an image.
The node graph of image nodes provides a top down "schematic" view of operations aplied over images. With an image (footage node) as the top most node, image processing operations represented by nodes, are connected to the footage node. Image data is passed top-down, from one node to the next node connected to it. Thus, the image is modified by each node which output the processed image at it;s output. This structure of nodes ilustrates the operations and the order of operations applied to images (footage node).
Image processing nodes have a button on the right side, with a icon symbolizing a stack of images, see the figure on the right.

This button shows the output image of the node, this is very usefull to inspect the different stages of image processing operations over footage through the node graph.
The advantage of using a node graph is it makes possible to edit the parameters of any node while visualizing the output of any node simultaneously.
The size of the output image is the same size as the input image. If a image node has more than one input, the size of the input more to the left is the one which sets the size of the output.
Creating a 3D effect
With 3D nodes you can create 3D effects and animations by manipulating objects in a 3D space. 3D nodes have red ports and can represent any element in the 3D space. A translation to a 3D object, a camera, a image plane, a light, or a 3D model. 3D nodes can represent 3D objects and transformations applied inside the 3D space. A 3D object can be something as simple as a cube, sphere, or cone, or as complex as a character. Although some basic geometric objects are included with Mewa Film, most geometry is imported from a 3D application. A model is another way to refer to a geometric object.
When building a 3D world with the node graph you can imagine an empty 3D space where you start adding 3D objects represented by nodes. Then you add nodes to position and rotate your 3D objects.
Use translate nodes and rotate nodes to animate the position and orientation of 3D objects, which can be connected to the camera node. A Camera node only shows the 3D objects connected to it. You create a scene hierarchy by connecting nodes. This hierarchy describes the relationship between objects where a parent object is connected to a child object. Transformations that you apply to the parent object are applied to its child object.
The camera node is the starting point to create any 3D effect, it has a button, with an eye icon, that opens a output window showing the scene.
Navigating the Node Graph
Pan
The mouse middle button to pans the node graph view.
Zoom
Use the mouse wheel to zoom in and out.
Editing a Node Graph
Creating Nodes
We start creating a node graph by adding nodes to the node graph window. To add nodes use the nodes tool bar, a menu appears listing the names of the available tools, just click the tool you wish to use and the corresponding node will be added to the Node graph.
Footage nodes are added to the node graph in a different way. See Add footage to the node graph to know more.
Moving Nodes
To move a node, select the node and drag it within the Node Graph window.
Selecting a node will also pop the parameters window of the node.
Selecting nodes
Nodes can be selected by mouse clicking, shift-clicking, or rubberbanding. Selected nodes are indicated by a blue stroke around the outside of the Node body. Items can be deselected by clicking on empty space in the node graph window.

To select nodes and edges with rubber band click with mouse left button on a empty space on the node graph window and drag the mouse to create the rubber band rectangle. When releasing, all items interecepted by the rubberband rectangle become selected.
The all node graph can be selected using keyboard shortcut Ctrl-A.
Connecting Nodes
Edges are the visual representation of a connection between nodes. To connect two nodes, with the left mouse button, click and drag from one node port releasing over another node port.
Note that only connections between ports of the same color are allowed, and also only connections between inputs and outputs are allowed.
Ports provide information whether a connection is allowed or not. A port become highlighted if it can be dragged to create a connection and if it can connect to the dragging edge. If a connection is not allowed, the destination port does not get highlighted.
Disconnecting nodes
One way to disconnect two nodes is deleting the edge connecting the two nodes and delete it. An edge is selected using the rubber band selection, see how to use the rubber band in selecting nodes. After selecting the edges, the edges become blue. Then just press delete key to delete it.
Parameters window
A movie, or animation, is a sequence of still images, called frames, that played in quick succession are perceived as continuous motion. An animation is created by changing the value of a parameter over time. A parameter can be anything from the position, rotation, scaling, or transparency of an object, to the gamma, gain, or offset in a colour correction. Basically, any node parameter can be animated.
Nodes parameters are shown in parameter windows when a node is selected. In this window you can modify all available parameters from a node.
It's possible to have more than one parameter window open ... all parameter windows have at the top ...
Using expressions in parameters
All parameters have a input box, where a value can be inserted directly. But not only values can be inserted, the input box also accepts expressions. e.g. insert the following expression 3*2.
The script editor can be used to check an expression. See Using the command line to read more.
Controlling a parameter with a curve
To create animations we use the curve editor. A curve is attached to a parameter in the same way as a expression, this is important because it makes possible to access information in any node and use it in a different node, in other words, use the same curve on as much parameters as we wish.
The curve editor button has 2 clickable areas, a area with an icon and a second area with a down arrow. The drop down at the right, if clicked, shows a list of the available curves. Selecting one of the listed curves will associate the parameter with the choosen curve. The input text box will then show curvename.value(time).
Instead of using the curve editor button you can write curvename.value(time) directly in the input text box. Note that the text becomes blue, mining that a curve was found and succefully attached.
Notes tab
All nodes have a notes tab where any text can be inserted.
Output window
The output window is used in the node graph to display the output at a specific node. It can display the view of a camera node or show the output image of a image processing node.
You can change any node parameters while watching the result at the output window. This ability to choose the node to be displayed in the Output window from the node being edited in the Parameters window is central to working with Mewa Film node graph.
The window title gives information about the shown output.
Output windows are mostly used with the node graph, but output windows can also be used in montage to preview images at full resolution, see how to view a frame at full resolution.
Output window of image processing nodes
Below is output window showing the output of a image processing node.

At the top left corner we have four check boxes named R, G, B and A reespectively. These check boxes, checked by default, represent image's RGBA channels. By modifying the state of these check boxes the user can isolate the channels, e.g the user wishes to view only the green channel, so will keep the green channel (check box named G) checked, and uncheck the R, B and A check boxes.
Followed by the channel check boxes we have the Fit button. When pressing the Fit button the shown image will be scaled and centered to fit the all image inside the output window.
Output window of 3D nodes
Node button is located on the right hand side of the node (see pic). Not all nodes provide a button, these button open a output window if none is already open.
The buttons symbol is described below ...

When a node button is toggled a output window pop if none is open already, a the corresponding data is shown.

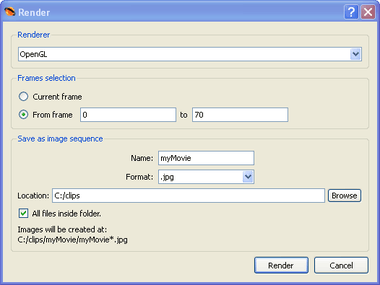
Render
Exporting the output is done on the output window. In the output window click ![]()
Multiple Parameter/Output windows
You can create as many parameter windows as you need and up to 3 output windows. Each output window can be set to independently display any image channel from any node in the current node tree.
The pin button is located in the top righ of the output window and is used to manage multiple output windows. Both parameter windows and Output windows have this pin button. Once one output window is open, by default the opened window will be used to display any node output.
To create additional Parameter/Output windows toggle the pin button, this holds the output to the node. When a Parameter/Output window is requested a new window will be created above the main window.