What is the Curve Editor
The curve editor is the heart of any animation, its a very intuitive graphical tool where you can model the behaviour of one or more parameters over time as a curve, e.g. to animate an 3D object we change the position and orientation of the object on successive frames to create the illusion of movement.
In the node graph each node has its own parameters shown at parameters window where they can be modified. To see the node's parameters just click the node to make parameters window pop up.
Every parameter have a input text box where a value or expression can be inserted.
If a expression is inserted in the text box, every time the current frame number changes the result of the expression inside the parameter text box is calculated, that's why if the parameter input box contains a number the parameter will have a constant behaviour through time.
To have different value for every frame than you add an expression, e.g. 2*time, where time represents the current frame number. To know more about expressions see the scripting chapter.
Well, it's also possible to create a custom function using a curve, and model the curve point by point. That's why the curve editor is so good, you dont need to understand maths or programming, with the curve editor you can create your own curve, and use it in any parameter in the same way an expression is used.
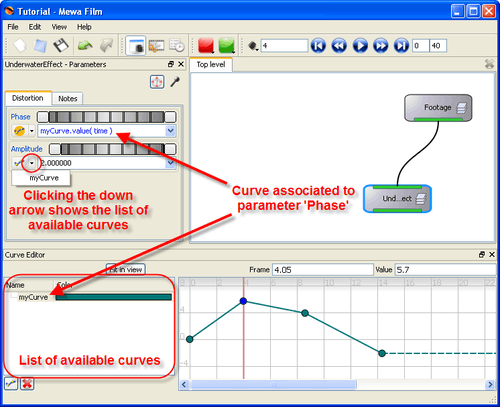
All parameters have a button ![]()
![]()
The Curve Editor window
To open the curve editor choose Curve Editor in the View menu.
Curve Editor window is divided in 2 panes, at the left pane we have the curve list, listing all the available curves. At right pane we have the area where the curve is edited.
A curve can have as many points as you need and each point has an interpolation method that can choosen. Every curve has 2 extrapolations.
Fit in view
The Fit in view button zooms the view to fit the selected points on the current view. If there are no points selected the Fit in view button will fit all points of the current selected curves.
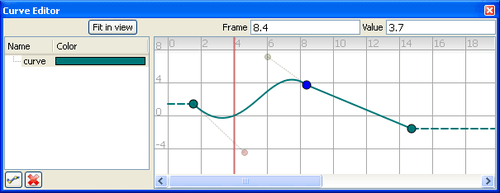
Frame and value input boxes
Frame and value input boxes are enabled only when 1 point of a curve is selected.
You may move curve points manually by dragging them with the mouse, or you may type the exact yy value at the value input box. The xx value of a point is called frame. By entering a value at the frame input box will move the selected point to the entered frame number.
Curve List
The curve list shows all the existing curves. When a curve is create, is added to this list.
To delete a curve(s) select one or more curves and click ![]()
Zoom and Pan
You may navigate the Curve Editor space by using the Middle Mouse button to pan and the mouse wheel to zoom.
Choose the curves to show
When we have many curves we may want to choose the ones we want to see and edit, for that reason only the selected curves from the curve list are shown. To select one curve just click the curve to show in the curve list. To select more than one curve, and consequently show more than one curve, hold Ctrl key while clicking on the desired curves.
Change curve color
The curve list shows all curves listed by name and respective color. If the rectangle containing the curve color is clicke a color dialog pops up allowing you to choose a different color for the curve.
Renaming a curve
- In the curve list double click on the curve to rename
- Type the curve new name followed by enter key.
All the parameters referencing the renamed curve will be updated with the new name.
Editing curves
Extrapolation lines are drawn as dash lines. There are 2 extrapolation regions, before curve extrapolation and after curve extrapolation.
Working with curve points
Manipulating the curve to obtain the desired curve is easilly achieved by moving and creating new points. To move a point mouse left-click over a point and drag to the new point position.
It's also possible to move a selection of points, selecting the points followed by a drag of one of the selected points.
There are several ways to select points in a cure, the most usual way is by is clicking on the point you wish to select. To select multiple points you can
- use the rubber band or
- hold shift key while clicking on the points to select.
Left mouse clicking in a empty area clears any selection of points.
To add points,
- click over a curve line, both curve line or extrapolation line. Note that the mouse cursor changes it's icon to a point finger icon to indicate that the mouse is over a line and if you click a point will be created.
- or use the context menu, right-mouse click and choose New Point.
Deleting points
- Select the points to delete and press delete key,
- or, right-click over one of the selected points to open the context menu and choose delete.
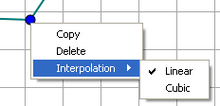
Curve Interpolation
Interpolation defines the shape of a curve between points. The interpolation mode is mostly used to choose the smoothness of the transitions of a curve between points, the smoother the transition between each point the less jitter you have in the respective animated parameter.
There are 2 interpolation methods available,
- Linear interpolation
- Cubic interpolation
The interpolation is set by point, this means 1 point can have linear interpolation and the next point can have cubic interpolation. The default is linear interpolation, which consists on a straight line between points.
To change the interpolation mode between points,
- right click on a point to open the context menu
- and from the context menu select an interpolation mode.
Cubic interpolation is more sophisticated than linear interpolation, it creates a bezier curve between 2 points. When cubic interpolation is chosen 2 tangent controls appear, also called handlers. Use these handlers to adjust the cubic interpolation to a desired form.
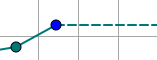
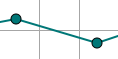 Linear interpolation |  Cubic interpolation |
Note that the left handler has a different color from the right hand side handler, this is to make it more easy to identify a handler when you have many handlers near to each other.
The interpolation between the selected point and the next point is changed. For example, the following figure shows the results of changing a keyframe’s interpolation from Constant to Hermite in an animation curve that uses Constant interpolation. Obviously the last point of a curve does not have a interpolation because does not have a next point to it.
To change the interpolation mode for a group of points,
- Press CTRL and select the points for which you want to change the interpolation,
- right click on one of the selected points to open the context menu,
- and from the context menu, select an interpolation mode.
Curve Extrapolation
Extrapolation is the region of the curve outide the movable points, represented as a dashed line with the same color as the curve. Extrapolation defines the shape of an animation curve before the first point or after the last point. The default extrapolation method is Constant extrapolation, which simply holds the value steady.
The extrapolation methods available are,
- Constant extrapolation
- Linear extrapolation
The constant extrapolation, as said before, holds the first or last point value steady. It looks as an horizontal line.
Linear extrapolation continue the value on its current slope.
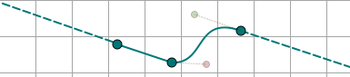
The slope of the linear extrapolation is defined by the point behind the last (or first) point, or by the cubic interpolation handler as shown by right side extrapolation of the image above.
To choose a extrapolation you use the context menu. To choose the extrapolation before curve right-click over the first point of the curve. To choose the after curve extrapolation activate the context menu on the last point of the curve.
Copy and paste points
- Select the points to copy and press Ctrl+C,
- move the play head to the frame which the copied points will be inserted,
- press Ctrl+V to paste.
Note that the curve's section after the play head is shifted to the right to give space for the new pasted points.