It is sometimes difficult to understand the behavior of a function given only its definition; a visual representation or graph can be very helpful. A graph is a set of points in the Cartesian plane, where each point indicates that . In other words, a graph uses the position of a point in one direction (the vertical-axis or -axis) to indicate the value of for a position of the point in the other direction (the horizontal-axis or -axis).


Functions may be graphed by finding the value of for various and plotting the points in a Cartesian plane. For the functions that you will deal with, the parts of the function between the points can generally be approximated by drawing a line or curve between the points. Extending the function beyond the set of points is also possible, but becomes increasingly inaccurate.

Example
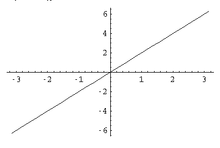
Plotting points like this is laborious. Fortunately, many functions' graphs fall into general patterns. For a simple case, consider functions of the form

The graph of is a single line, passing through the point with slope 3. Thus, after plotting the point, a straightedge may be used to draw the graph. This type of function is called linear and there are a few different ways to present a function of this type.

Slope-intercept form
When we see a function presented as

we call this presentation the slope-intercept form. This is because, not surprisingly, this way of writing a linear function involves the slope, , and the -intercept, .


Point-slope form
If someone walks up to you and gives you one point and a slope, you can draw one line and only one line that goes through that point and has that slope. Said differently, a point and a slope uniquely determine a line. So, if given a point and a slope , we present the graph as


We call this presentation the point-slope form. The point-slope and slope-intercept form are essentially the same. In the point-slope form we can use any point the graph passes through. Where as, in the slope-intercept form, we use the -intercept, that is the point .

Calculating slope
If given two points, and , we may then compute the slope of the line that passes through these two points. Remember, the slope is determined as "rise over run." That is, the slope is the change in -values divided by the change in -values. In symbols,


So now the question is, "what's and ?" We have that and . Thus,


Two-point form
Two points also uniquely determine a line. Given points and , we have the equation

This presentation is in the two-point form. It is essentially the same as the point-slope form except we substitute the expression for .
